You might want to export your discovery, publication, runtime presentation, or tabulation (if you are a Tabulate user) to Excel if you need to work with data offline in a familiar spreadsheet format or you want to share structured insights with colleagues who prefer Excel.
Alternative: You can share your artifact with other users (recipients), either by attaching the exported content to an email or by sending a Share Link to the recipient for access in Pyramid. For more information, see Share Content dialog.
Excel Sheets and Target Format
By default, each visual is exported as a Tabular Grid to a separate Excel sheet and, if the visual is a Matrix Grid, it retains that format. However, if the Excel export exceeds the memory limits described below, the system automatically switches to CSV, which is a flat/raw format.
Sheet naming
By default, the sheet / tab is named using the report title, which is also added to the top of the Excel sheet when the Show Title checkbox is selected.
Note: When a publication that includes a Page Repeater is exported to Excel, each of the repeated pages is created as a sheet in the tabbed Excel Workbook. The tab names reflect both the report name and the selected element used by the repeater. For more information, see Excel with Page Repeaters.
Performance limitations
For performance reasons, an evaluation based on the machine's memory takes place when exporting to Excel, limiting the number of cells that can be exported. If the limit is exceeded, the export defaults to CSV format.
- 32 GB RAM or more: Up to 9 million cells.
- 24 GB RAM: Up to 7 million cells.
- 16 GB RAM: Up to 5 million cells.
- 8 GB RAM or less: Up to 3 million cells.
Formatting in Excel
When printing and exporting to Excel, the formatting is retained as far as possible in the output spreadsheet. This ensures consistency and usability. Visual styles (bold, underline, and so on for text) and structural adjustments (borders and so on) are retained, making the output Excel spreadsheet as much like the source visual as possible. Preserving your formatting enhances the accuracy of data presentation, makes sure your spreadsheets appear highly professional, and minimizes the need for manual reformatting after export.
The following formatting is typically preserved during export to Excel:
- Row background color.
- Text formatting, which includes font, styling, text alignment, and so on.
- Custom Grand Total Text.
- Header formatting.
- Theme formatting.
- Report title.
Note: Depending on your selection from the Context dropdown list (see below), the target spreadsheet can also include details of custom sort and filter options. This might include names of slicers, selected slices, details of applied value-filters, and so on.
Show Title and Context in Export
You can show the title, breadcrumbs, and other custom filtering / sorting options from the report in the exported sheet by selecting Excel and the appropriate printing options.
Note: There are no Export options when you export a tabulation to Excel.
Excel
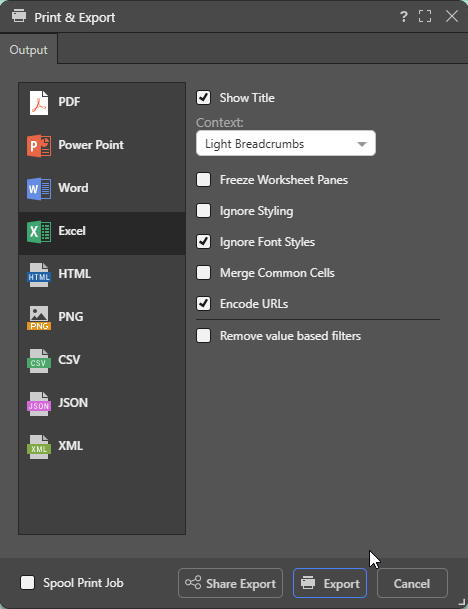
Once you have selected the Excel option in the Output panel, you can select the formatting options that dictate how your output should be formatted.
Note: When you export your content to a spreadsheet, the filters are typically applied to the output as set at time of printing.
Show Title
Select the Show Title checkbox to include the report name in the exported spreadsheet. By default, this value reflects the saved name of the report as seen in Discover (status bar and app tab).
Tip: You can override this value by specifying a Custom Value as the Title in the Report Title formatting options for the discovery. In this case, the custom value is shown both on the canvas and in the exported spreadsheet. Note that, if you select Breadcrumbs from the Title field, the title in the exported spreadsheet will either be the Custom Value (where a custom value is defined) or the saved report name (where a custom value is not defined).
Context
Select an option from the Context dropdown list to describe the filtering associated with the discovery:
- Light Breadcrumbs: Include a row describing the report hierarchies and measures, followed by selected slicer values in parentheses.
- Enumerated Breadcrumbs: Include a row describing the report hierarchies and measures, followed by the slicer name and selected slicer values as colon-separated pairs.
- Explicit Details: Add all Breadcrumb details to the spreadsheet as a table of details. The details include Slicers and Parameters and their selected values and details of any Sort and Filter captions that are currently filtering the content of the visual.
- None: Don't include any context information.
Freeze Worksheet Panes
Not relevant to Grids. Freeze the panels in your worksheet to keep the header information (title, visual, context, and the header for the data table) visible while you scroll through the data in the rest of your worksheet.
Ignore Styling
Matrix Grids only. Do not export styles from the source to the target spreadsheet.
Ignore Font Styles
Matrix Grids only. Do not export font styles from the source to the target spreadsheet.
Merge Common Cells
Matrix Grids only. Where adjacent or contiguous cells contain the same content, merge those cells. This has the same effect as the Merge and Center tool.
Encode URLs
Select the Encode URLs checkbox to automatically replace some "unsafe" characters in URLs, such as spaces, colons, or slashes, with their corresponding encoded values. For example, selecting this option replaces ?search=hello world with ?search=hello%20world in the exported spreadsheet.
The relevant "unsafe" characters are: < > \ / ? & # : ; = and Space.
Remove value-based filters
Where a value-based filter has been applied to data, select this option to remove that filter and export the entire dataset rather than only the filtered values.
Note: This option removes value filters and not slicer filters. As an example, it removes value filters that limit data based on values and metrics, such as top 10% of sales, but does not remove the filtering effect of slicers, such as where France is the element selected from a Country slicer. For more information, see Value Filtering in Discover.
Example Context Selections
The following examples show how the exported output from a discovery appears when making different formatting selections from the Show Title checkbox and Context dropdown list in the Print & Export dialog:
The following examples show the spreadsheet exported from the following Matrix Grid in Discover:
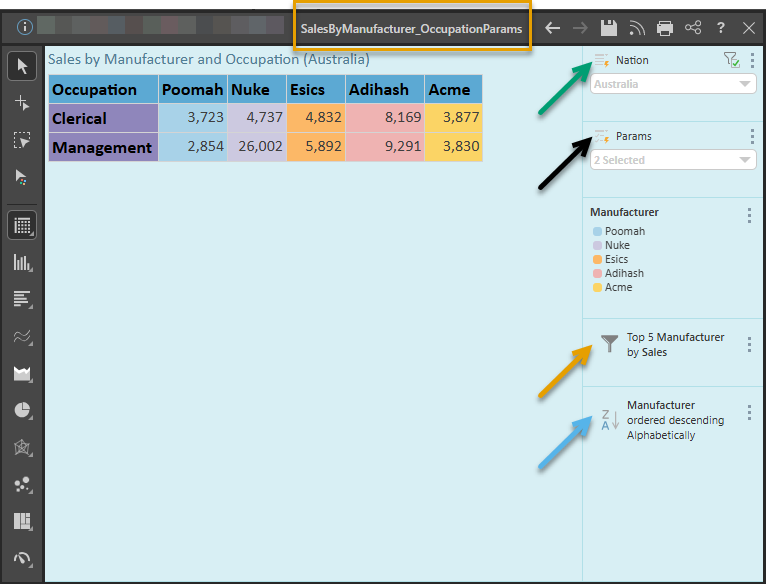
Note: The example discovery includes a Nation Slicer (green arrow), a Parameter (black arrow), a Legend, a Filter node (orange arrow), and a Sort node (blue arrow). The saved Report Title is also highlighted in orange. You can describe some or all these selections in the output spreadsheet by selecting different options from the Context dropdown list.
In this example, the report above was exported to Excel with Show Title and the Context Light Breadcrumbs selected:
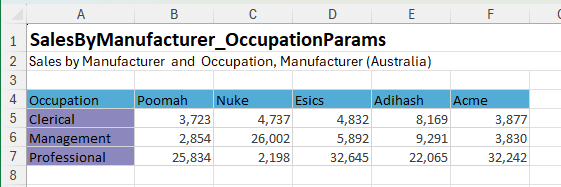
The spreadsheet contains the following context details:
- Show Title: The report title shown in the exported spreadsheet typically reflects the saved name of the report as seen in the status bar and app tab, as shown in the preceding example. You can override this value, as described above.
- Context - Light Breadcrumbs: The breadcrumbs applied at the time of export appear in row 2. Where Light Breadcrumbs is selected as the Context, the breadcrumbs show the hierarchies and measures (Sales by Manufacturer and Occupation, Manufacturer), followed by slicer values in parentheses (Australia).
In this example, the report above was exported to Excel with Show Title and the Context Enumerated Breadcrumbs selected:
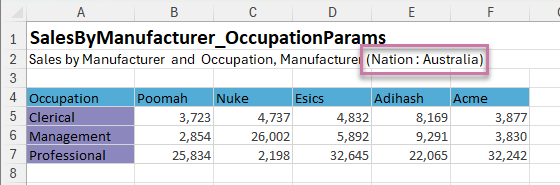
The spreadsheet contains the following context details:
- Show Title: As described above.
- Context - Enumerated Breadcrumbs: The breadcrumbs applied at the time of export appear in row 2. Where Enumerated Breadcrumbs is selected as the Context, the breadcrumbs show the hierarchies and measures, followed by the slicer names and selected values in parentheses (purple highlight above).
In this example, the report above was exported to Excel with Show Title and the Context Explicit Details selected:
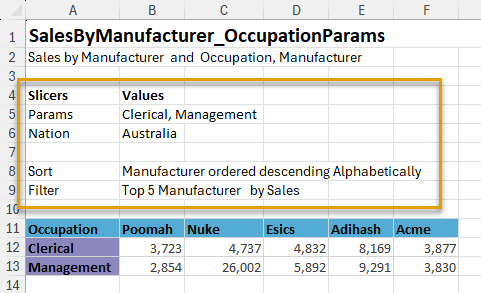
The spreadsheet contains the following context details:
- Show Title: As described above.
- Context - Explicit Details: Where Explicit Details is selected as the Context, the hierarchies and measures appear in row 2 and the additional filter details are shown in the subsequent table (orange highlight above). The table includes the names and selected values for the slicers (including the parameter in the preceding example) and then the details of the sorting and filtering applied to the discovery.
Related information
Show Title and Breadcrumbs
In Discover Pro or Lite, if you are exporting to PDF, PowerPoint, Word, or HTML, you can make use of a similar option to the Show Title and Context options described above. Selecting the Show Title and Breadcrumbs checkbox adds the report title and the Light Breadcrumb trail to the exported file. The Light Breadcrumb trail describes the report hierarchies and measures, followed by any selected slicer values in parentheses.
- Click here for more information